Before You Listen
- Prerequisites: the difference between paraplegia (legs) and tetraplegia (all four limbs); the basic ASIA Impairment Scale (AIS) categories A through E, covered in detail next chapter; awareness that the cord has cervical, thoracic, lumbar, sacral and coccygeal segments; basic outpatient PM&R vocabulary (clean intermittent catheterization, pressure injury, autonomic dysreflexia).
- Runtime: 45 minutes. The existing recording predates this text correction, so the statistics below are the current teaching source.
- Topic in one line: the 54 per million annual incidence of traumatic spinal cord injury (SCI) and the 18,482 new cases per year estimated by the National Spinal Cord Injury Statistical Center (NSCISC) at the University of Alabama at Birmingham, the 311,560 Americans living with SCI, the bimodal age curve with peaks in young adults (motor vehicle crashes [MVCs], violence, sports) and adults aged 65 and older (falls, often producing central cord syndrome on a spondylotic spine), the male-to-female ratio of about 4:1, the rise in mean age at injury from 29 years in the 1970s to 44.3 years since 2015, the etiology rank order (vehicular 37.1%, falls 32.5%, violence 15.2%, sports 7.6%, medical/surgical 3.8%), the dominance of incomplete tetraplegia (47.7%) as the most common neurological category, the historical shift in leading cause of death from genitourinary disease to respiratory disease, the association between education and return to work, the life-expectancy gap that widens with injury severity, and the prevention ladder anchored by Sir Ludwig Guttmann’s Stoke Mandeville model and Jack Lapides’ clean intermittent catheterization (CIC).
Vignette. A 67-year-old retired carpenter trips over a curb while walking his dog, falls forward, and instinctively extends his neck. He cannot get up. In the emergency department his GCS is 15, plain films and CT show no fracture or dislocation, and MRI demonstrates cord edema centered at C4 to C6 with pre-existing degenerative changes. Examination shows weakness that is markedly worse in the hands than in the legs, with impaired pinprick at the level of injury and preserved proprioception throughout. He is worried about returning home and caring for his dog.
Which incomplete syndrome best fits the stem, what examination is required before an AIS grade can be assigned, what etiologic category does this fall sit in within current NSCISC trends, and how should population outcome data inform his counseling?
Section 1: Incidence, Prevalence, and the NSCISC Database
Bottom line: U.S. incidence of traumatic SCI is about 54 per million per year, an estimated 18,482 new cases annually excluding scene deaths; prevalence is 311,560; the NSCISC at UAB is the canonical longitudinal registry, with data reaching back to 1973 and 38,647 longitudinal participants in the current report.
The NSCISC 2026 Facts and Figures report gives a U.S. traumatic SCI incidence of 54 cases per million population per year (5.4 per 100,000), which corresponds to an estimated 18,482 new cases annually. That estimate excludes people who die at the scene before reaching the hospital. It is scaled from an incidence estimate and the national population rather than counted directly in a registry, so it is an estimate of the country, not a tally of enrollments. There is no verified separate figure that adds scene deaths back in.
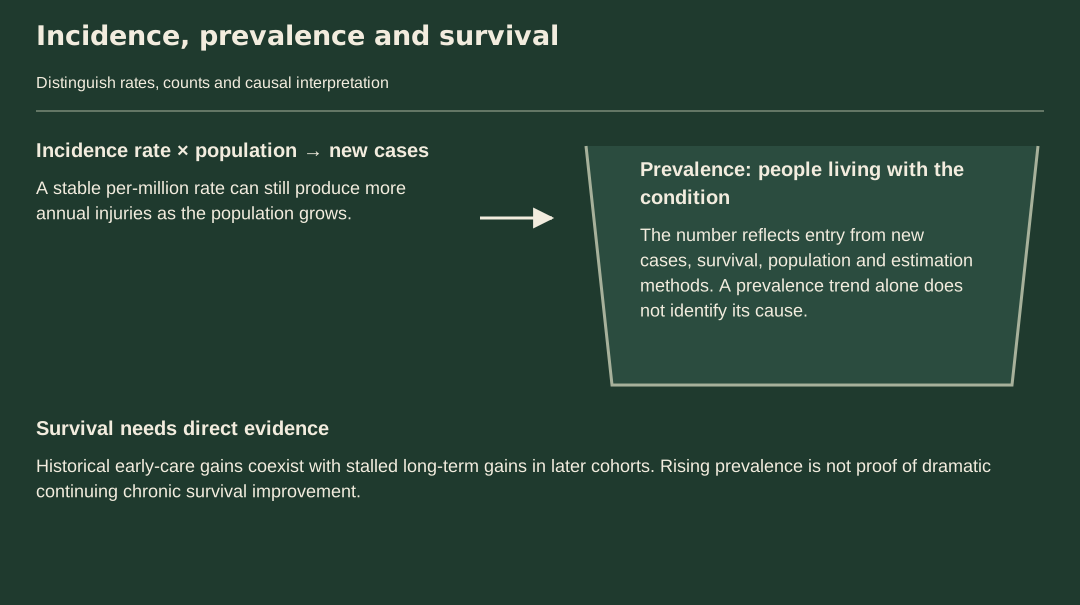
Estimated U.S. prevalence is 311,560, with a reported range of 261,168 to 399,079. Prevalence counts people living with the condition; incidence counts new injuries over time. The two move independently: even with a flat incidence rate, population growth raises the annual number injured, and longer survival enlarges the pool of people living with SCI. Prevalence also depends on the estimation model, so a rising prevalence figure is not by itself a measurement of improving long-term survival.
The National Spinal Cord Injury Statistical Center (NSCISC) is maintained at the University of Alabama at Birmingham (UAB) and aggregates data from the federally funded Model Spinal Cord Injury Care Systems. The Model Systems program was established in 1970 and the database dates from 1973. The 2026 report contains 38,647 longitudinal participants, separately excluding 16,477 registry-only records, with data collection through August 2025. Boards reference the NSCISC by name, and it is the source of most U.S. SCI epidemiology numbers that get tested. It is a selected care-system cohort rather than a census of every U.S. injury, and a registry is not an examination key.
For the global picture, GBD 2019 modeled 0.9 million new all-cause SCI cases (uncertainty interval 0.7 to 1.2 million), 20.6 million prevalent cases, and an age-standardized incidence of 11.5 per 100,000 (8.9 to 14.6) across 204 countries and territories, using available data from 93 of them. That definition combines traumatic and nontraumatic SCI, and the rate is age-standardized, so it is not interchangeable with the crude U.S. traumatic rate of 5.4 per 100,000. Before comparing any two countries, check four things: case definition, year, age standardization and denominator.
High Yield — Incidence and prevalence anchors
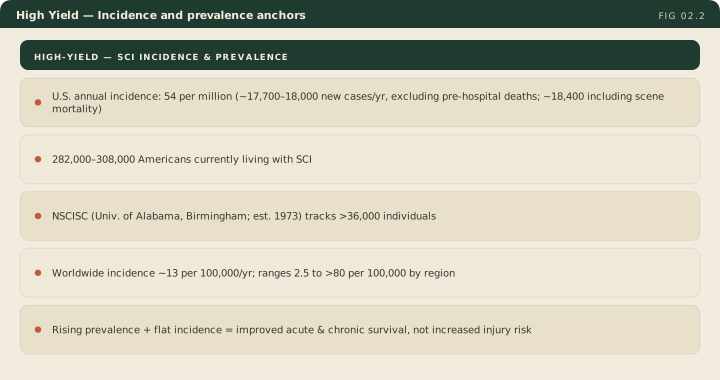
- 54 per million per year: U.S. traumatic SCI incidence, 2026 NSCISC report.
- 18,482 estimated new U.S. cases per year, excluding scene deaths.
- 311,560 Americans living with SCI; reported range 261,168 to 399,079.
- NSCISC at the University of Alabama at Birmingham; database from 1973; 38,647 longitudinal participants in the 2026 report.
- GBD 2019 worldwide: 0.9 million new all-cause cases, 20.6 million prevalent, age-standardized incidence 11.5 per 100,000.
- Match traumatic against all-cause definitions and crude against age-standardized rates before comparing regions.